First, find it.
Separate reports and metrics. Analysis starts by figuring out what to compare.
Ask about your sales in your own words. Get charts and an explanation to keep exploring with your team.
A sales meeting starts with a simple question: “What’s happening with sales?” Reaching a shared reading takes more work.
Separate reports and metrics. Analysis starts by figuring out what to compare.
Revenue, liters and average price each tell a different part of the same sale.
Every answer opens another comparison. You need to keep the thread.
What if you could ask that question
to a sales analyst?
Retail Analytics lets you ask about consumer goods sales in natural language and get data, charts and an interpretation to keep investigating.
“Which chains account for most of our sales?”
Which metric, which period and which universe is being analyzed.
Compare chains, prices or regions within the available scope.
Review what the answer shows and ask the next question.
A space to ask, understand the answer and keep the conversation going.
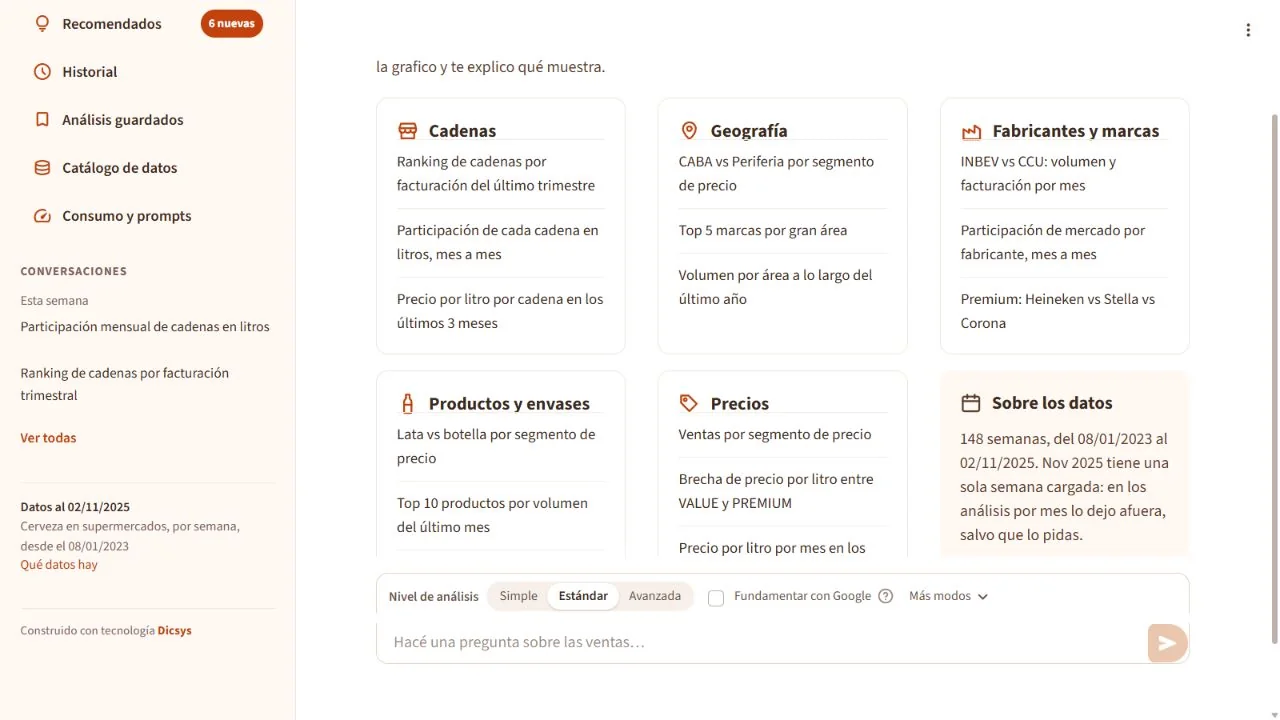
Pick a business question. Walk through the real chat: the question, the answer, the chart and what comes next.
Beer sales in Argentine supermarkets · Data available as of Nov 2, 2025 · Walkthrough based on screenshots; no new queries are run.
Meet your sales analyst and see how a question turns into an analysis.
See the demo